Recruitment analytics is the practice of collecting, measuring, and interpreting data across the hiring process to make faster, smarter talent decisions. It turns raw recruiting activities like applications, interviews, offers, placements, into insights that help staffing firms and HR teams understand what’s working and what’s costing them.
In simple terms, recruitment analytics tells you where your hiring process is performing, where it’s breaking down, and what to do about it.
Why Recruitment Analytics Matters
Recruiting without analytics is like running a sales team without a pipeline report. You’re moving, but you don’t know which direction is forward.
For staffing firms managing high volumes of job orders across clients, roles, and geographies, the complexity multiplies. Decisions made on gut instinct, which sources to use, which recruiters to assign, which roles to prioritize quietly drain revenue and erode client trust.
Recruitment analytics gives HR leaders and recruiters the evidence to:
- Identify bottlenecks slowing down time-to-fill across specific roles or clients.
- Measure recruiter performance fairly, with data not perception.
- Allocate sourcing budget to channels that actually produce placements.
- Spot drop-off points in the candidate pipeline before they become a pattern.
- Report hiring performance to leadership with confidence and precision.
Key Metrics in Recruitment Analytics
1. Time-to-Fill
The average number of days between a job order opening and a confirmed placement. The single most-watched metric by staffing firms and their clients.
2. Cost Per Hire
Total recruitment spend like sourcing, tools, recruiter time, divided by the number of hires made. Reveals the true financial efficiency of your hiring operation.
3. Offer Acceptance Rate
The percentage of offers extended that candidates accept. A low rate signals misalignment between compensation, expectations, or candidate experience.
4. Submittal-to-Hire Ratio
How many candidate submissions it takes to close one placement. High ratios indicate sourcing or screening quality issues upstream.
5. Pipeline Conversion Rate
The percentage of candidates who move from one stage to the next, sourced to screened, screened to submitted, submitted to placed. Shows exactly where the funnel leaks.
6. Source Effectiveness
Which sourcing channels produce the most qualified candidates and successful placements. Drives smarter budget and effort allocation.
7. Recruiter Productivity
Individual recruiter output measured across submissions, interviews scheduled, placements made, and revenue generated.
Recruitment Analytics in Oorwin
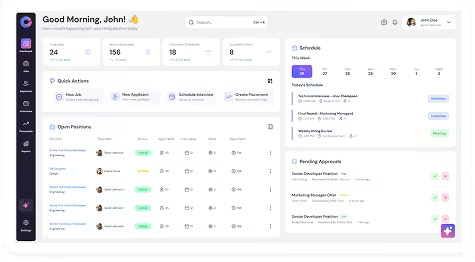
Oorwin’s analytics layer sits across the entire hiring workflow, giving staffing teams real-time visibility without building reports manually.
- Real-Time Dashboards: Monitor live metrics like time-to-fill, pipeline conversion, source performance — across roles, clients, and teams from a single view.
- Automated Reporting: Scheduled reports surface recruiter productivity, job order status, and placement trends without anyone pulling data by hand.
- AI-Driven Insights: Oorwin’s Talent AI identifies patterns in your pipeline flagging bottlenecks, underperforming sources, and roles at risk of going unfilled, before they escalate.
- Custom KPI Tracking: HR leaders can configure dashboards to track the metrics that matter to their specific clients, verticals, or business goals.
With Oorwin, recruitment analytics isn’t a reporting exercise at the end of the month. It’s a live signal your team acts on every day.